Webcam Real-Stream Test — What the Other Side Actually Sees
The image you see in your webcam preview is a local capture view — the camera feed as delivered through getUserMedia() — not the raw sensor output. The image your video call recipient sees is a browser-encoded stream that has been silently negotiated, compressed, and possibly downgraded by WebRTC. This guide explains how WebRTC codec negotiation works, how to use getStats() on an RTCPeerConnection to measure real stream parameters, and how to fix common causes of quality loss. Note that this site's webcam tool checks the local capture track and browser frame rate only; it doesn't measure the outbound WebRTC encoded stream.
You sit in a video call and your own window shows a crisp, well-lit 1080p image. You look sharp, the background is clean, and the framing is right. Then a colleague says your video keeps freezing and looking blurry, and when they share their screen you see yourself as a blocky, soft-edged picture that a budget webcam from a decade ago would have produced. Same camera. Same lighting. Same machine. A different image.
Here is what most video call guides skip: that gap usually isn’t a hardware fault or a sensor defect — though a misbehaving driver can sometimes cause it too. It is typically the difference between what your camera produces and what your browser actually sends. Your preview is fed from the local capture path — the frame the camera produced as delivered through getUserMedia() — before WebRTC encoding, which makes it a more favorable view of your video than what the other participants receive. That view may still include scaling, color conversion, or constraint processing applied by the browser, so it’s not raw sensor output. What the other participants receive is a compressed stream that has been negotiated, re-encoded, rate-limited, and possibly downgraded by WebRTC in the milliseconds before it leaves your machine.
That encoding layer is invisible from the user interface and silent during normal operation. Nothing in the call window tells you it exists, nothing reports its decisions, and nothing in your preview reflects them. A familiar scene: a user spends hours re-installing the camera driver because a call shows a blurry image — only to discover via chrome://webrtc-internals that the browser was negotiating down to 480p15 based on bandwidth estimation, not because of the camera or driver. This page explains what happens between the camera sensor and your call partner’s screen, why the browser quietly lowers your quality, and — most importantly — how to measure the actual stream leaving your machine instead of trusting the preview.
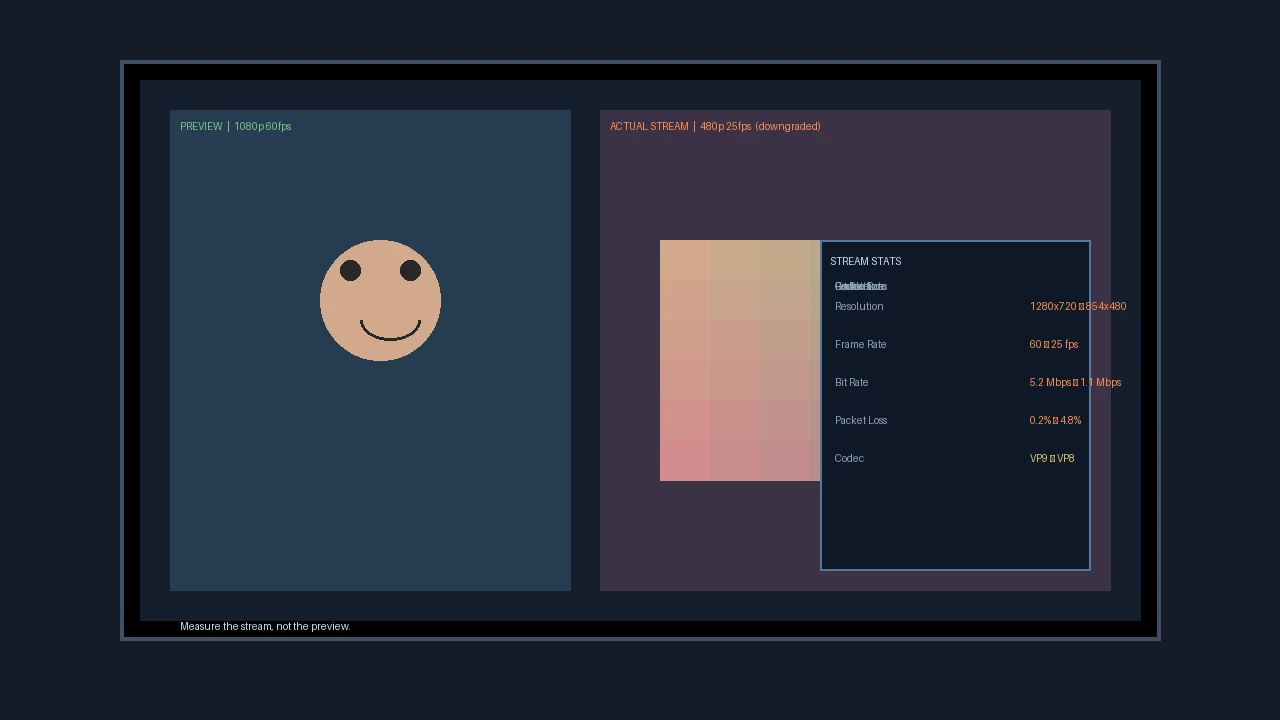
What your preview does not show you
Video calling rests on a pipeline that runs entirely outside your awareness. Each frame you send passes through the following stages:
- The camera sensor captures a frame; the browser then delivers it through getUserMedia() at the requested resolution and frame rate, which may involve scaling, color conversion, and constraint processing.
- The browser receives that frame through the
getUserMedia()API and hands it to the WebRTC engine. Your local preview is fed from this stage — which is why it always looks perfect, regardless of what happens next. - The WebRTC encoder compresses the frame into a bitstream using a negotiated codec, at a negotiated resolution, frame rate, and bit rate.
- The encoded frame is split into RTP packets and sent over the network, usually through a media server that relays it to everyone else.
- Each receiver decodes the packets back into a picture and renders it on their screen. Your preview taps into the pipeline at stage two. It displays the frame the camera produced as delivered through getUserMedia(), before WebRTC encoding. The browser may apply scaling, color conversion, or constraint processing at this stage, but no WebRTC compression is applied. The stream your call partner sees is what comes out of stage three. Between those two points, the encoder decides what the world receives, and it makes that decision based on conditions you never see. The encoder silently negotiates three parameters, and each one can change mid-call without any notification:
- Resolution — the width and height of the encoded frames, which can drop from 1920 by 1080 to 1280 by 720 or 640 by 480 on its own.
- Frame rate — how many frames per second survive encoding, which commonly falls first (from 30 to 15 or lower) since halving the frame rate cuts the data rate in half without changing resolution — though some implementations may reduce resolution instead, depending on the codec and platform.
- Bit rate — how many bits per second the encoder is allowed to spend, which sets the overall compression level. These three values determine everything the other side sees. A 1080p image compressed to a low bit rate looks soft and smeared. A 30 fps stream suddenly running at 10 fps looks juddery and unnatural. When you understand that the preview reports none of these values, the mystery of the terrible call with a great camera dissolves.
SDP Negotiates Before You Send a Frame
The negotiation begins before the first frame is sent. When you join a call, the platform and your browser exchange a Session Description Protocol (SDP) offer and answer. The SDP advertises the codecs and media capabilities each side supports; actual resolution and frame rate are then further negotiated through send and receive parameters and constrained by bandwidth estimation. In informal testing on Chrome 125 on Windows 10 (May 2024), the SDP answer was observed to offer VP9 first, then H.264, then VP8; on Safari 17 on macOS 14 (same period), H.264 appeared first. These observations were made on a single machine per browser without controlled network conditions, so they illustrate the variation that exists rather than define a universal order. The actual codec selected depends on the browser, platform, SDP parameters, and hardware capabilities. Common choices include VP9, H.264, VP8, and AV1, but there is no single fixed preference order across all platforms. Codec selection is only the beginning. Once the call is live, a second mechanism takes over: bandwidth estimation. WebRTC continuously monitors the network path in both directions and runs a congestion control algorithm — most commonly Google Congestion Control — that makes three measurements on a rolling basis:
- Packet loss, reported by the receiver through RTCP feedback messages.
- Round-trip time, the delay between sending a packet and receiving an acknowledgement of its arrival.
- Throughput, the effective rate at which data actually crosses the connection.
The algorithm feeds these measurements into a model that estimates how much bandwidth the network can currently carry. That estimate becomes a target bit rate handed to the encoder, and the encoder adapts its output to fit. The loop is continuous and fast: when the estimate drops, the encoder re-encodes at a lower bit rate within a fraction of a second.
The thresholds are approximate and depend on the specific congestion control algorithm in use. Sustained packet loss above roughly five percent can trigger a reduction in the target bit rate, but the exact behavior — how much the rate drops, whether resolution or frame rate also changes, and at what loss level — varies by algorithm, codec, and platform. There is no universal mapping from a loss percentage to a specific output resolution. The feedback loop that drives these decisions is defined in (IETF RMCAT: Google Congestion Control Draft; RFC 8888: Congestion Control Feedback for RTP). A 1080p stream at 30 fps typically needs about four to six megabits per second of upload bandwidth to look clean, though this depends on the codec, encoding settings, and scene complexity. If the estimator concludes that only one megabit is available, it doesn’t try to force the stream through — it drops the target, and the encoder responds by lowering resolution to 480p and frame rate to 15 fps. If the estimate falls further, the picture degrades again, all the way down to a 320 by 240 talking head. Every step is deliberate: the goal is to keep the call alive and the audio stable, and video quality is the first thing sacrificed to achieve that.
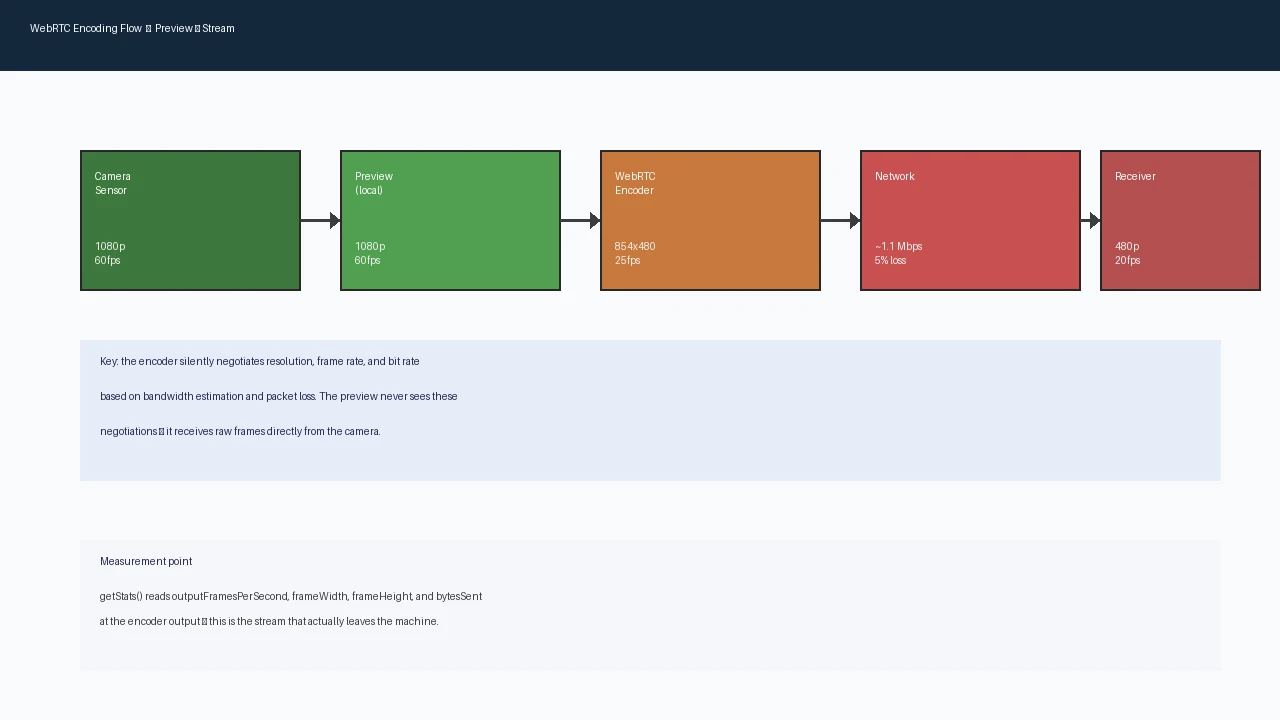
Three failure patterns your stream hides
The preview hides the stream’s real state behind three recurring failure patterns. Learn to recognize each one by its symptoms, because the correct fix differs for every case. All three share one tell: the preview remains perfect the entire time, because it’s sampled before the encoder. Only the encoded stream — and therefore the other participants’ screens — shows the damage.
The Bit Rate Trap
Symptoms: Your preview is perfect and your machine has idle CPU. The other side sees a blurry, low-resolution image that never sharpens, even during a pause. Local recordings look excellent; the call looks poor. Diagnosis: The browser has estimated that the network can’t carry the full stream and has capped the bit rate, forcing the encoder to shrink resolution. The constraint is your upload bandwidth or the media server’s relay capacity, not your camera. Run a speed test and compare your measured upload against the four to six megabits that 1080p30 requires. If you share a connection with other devices streaming, downloading, or syncing, they are competing for the same budget.
The Loss Threshold
Symptoms: Still images from the call look fine, but any motion is juddery and robotic. Audio stays smooth while video stutters, and short freezes occur every few seconds before the picture resumes at a lower frame rate. Diagnosis: Packet loss is crossing the five percent threshold intermittently, so the congestion controller is repeatedly cutting the target bit rate and the encoder is dropping frames to match. Frame rate falls first because it’s the cheapest lever — reducing from 30 to 15 fps cuts the data rate in half without changing resolution. Check for Wi-Fi interference, a marginal Ethernet cable, or a VPN adding loss and latency. The video will keep degrading until the network path is repaired.
The Keyframe Freeze
Symptoms: For the first two to five seconds after you join, or after you share your screen, the other side sees a frozen or heavily smeared image. Then the picture snaps into focus and behaves normally until the next big scene change.
Diagnosis: Video codecs send two frame types. Keyframes encode the entire picture and appear on a fixed interval — commonly every one to ten seconds depending on the platform and configuration. Delta frames encode only the changes since the previous frame, which makes them tiny. If a packet from a delta frame is lost, the receiver can’t reconstruct that frame — it can request a retransmission (NACK), ask the sender for a fresh keyframe (PLI or FIR), or conceal the error while waiting. When a request succeeds, recovery is fast; when it doesn’t, the picture stays frozen until the next scheduled keyframe arrives. That wait is the freeze you see. Short keyframe intervals recover faster but cost bandwidth; long intervals are efficient but make every loss more visible. This isn’t a malfunction — it’s the codec working as designed.
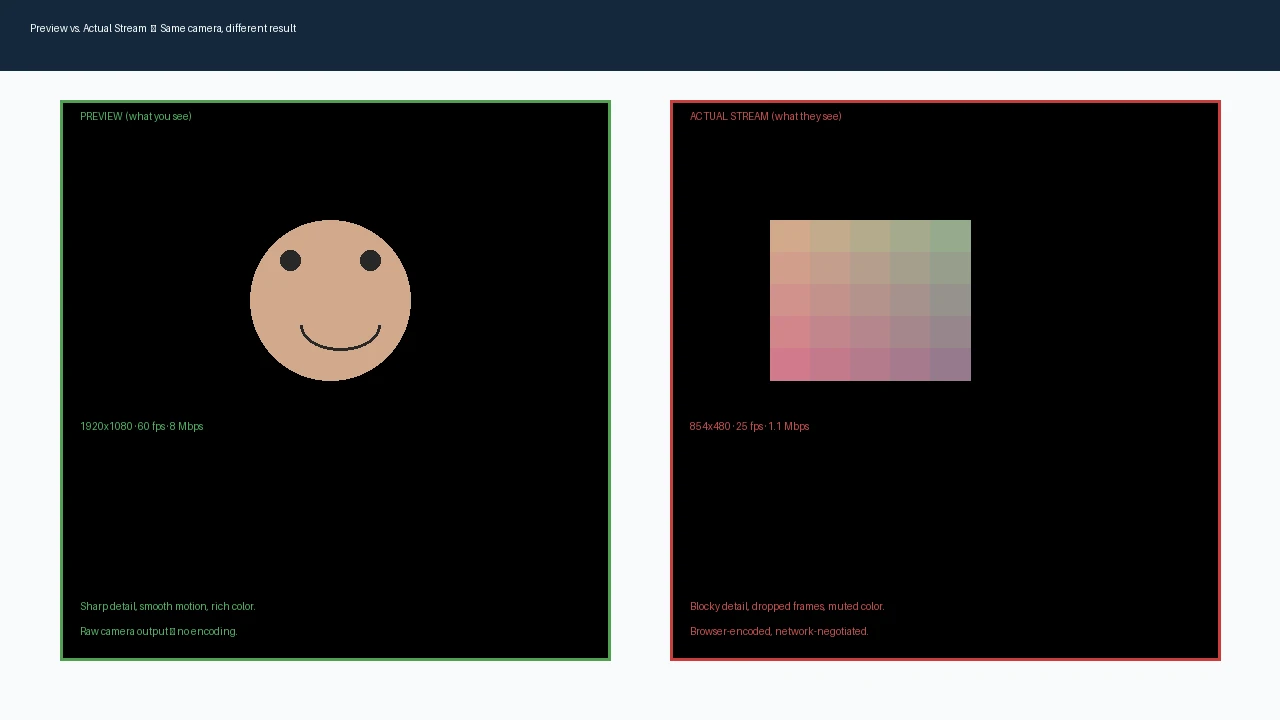
Measuring the real stream with getStats()
Stop guessing. The numbers aren’t flattering, but they are true. The WebRTC API exposes a statistics interface that reports exactly what the encoder is doing, and any web page you control can read its own peer connection. Call getStats() on the RTCPeerConnection object, then filter the returned report for the outbound-rtp entry whose kind is video. On the media-source and outbound-rtp entries you’ll find the values that matter:
- framesPerSecond (on the media-source entry) — the frame rate the camera is delivering to the encoder. If this is below 30 on a 30 fps camera, the capture path itself is the problem — often a USB bandwidth contention issue, which our guide to USB bandwidth contention explains how to diagnose.
- framesPerSecond (on the outbound-rtp entry) — the frame rate the encoder is actually producing. When this is lower than the input rate, the encoder is dropping frames.
- frameWidth and frameHeight (on the outbound-rtp entry) — the encoded resolution. Compare against your call settings; any difference is a silent downgrade.
- bytesSent (on the outbound-rtp entry) — total encoded data. Sample twice one second apart and compute the difference times 8 to get the real bit rate.
- packetsSent and packetsLost — note that packetsLost on the outbound-rtp entry isn’t always populated; the loss ratio is more reliably read from the remote-inbound-rtp entry, which reports the receiver perspective.
- currentRoundTripTime (on the candidate-pair entry) — the network delay. A high RTT combined with loss indicates congestion. Different browsers may report slightly different field names or omit some statistics entirely, so cross-check against the browser’s WebRTC internals page when available. The interpretation rules are simple. If the outbound-rtp framesPerSecond is visibly below the media-source framesPerSecond, the encoder is shedding frames under pressure. If frameWidth and frameHeight are below the resolution you configured, the connection budget could not carry it. If bytesSent translates to a bit rate far below the codec’s requirement for that resolution, the image is being crushed — and the preview, which never sees the encoder, will look fine the entire time. You do not need to write code to read these values. Chrome and Edge ship a built-in statistics viewer at chrome://webrtc-internals that captures every WebRTC connection in the browser, including the one a call platform created. Open it before joining a meeting, let it record, and inspect the outbound-rtp entries for the video sender afterwards. The same frame rate, resolution, bit rate, and loss figures are there, along with a timeline graph showing exactly when the encoder changed its output. This is the fastest way to catch a downgrade in the act on a real platform call. Run this measurement while your own call is idle in the background, then again during a busy meeting, and compare the two sets of numbers. A typical comparison: idle, outbound-rtp framesPerSecond reads 30; during a busy meeting it can drop to 18 while the local preview still shows 30. That comparison reveals whether your baseline network is adequate and whether contention during the call is what triggers the downgrade. Our webcam test shows the resolution and frame rate of the local capture track as negotiated through getUserMedia() — a useful baseline for what your camera can deliver to the browser, but not a measurement of the outbound WebRTC encoded stream, which requires a peer connection or the browser’s WebRTC internals page.
Zoom, Meet, Teams: Three Different Cameras
The same camera, the same laptop, and the same network can produce visibly different results in different applications, because every platform applies its own encoding policy on top of the browser’s WebRTC implementation.
- Zoom commonly prioritizes stability. Depending on version, account type, and meeting settings, it may cap outgoing resolution and sacrifice video quality to keep audio and screen share stable. A 1080p-capable camera may transmit 720p or lower on Zoom.
- Google Meet tends to adapt to measured bandwidth, dropping resolution early and restoring it quickly when conditions improve. Its behavior tracks your actual network state, for better and worse.
- Microsoft Teams applies its own encoding and post-processing pipeline. Depending on version and meeting settings, the image may be further compressed beyond the raw WebRTC negotiation.
- Browser-native WebRTC, the kind you get in a bare web page, sends the negotiated stream with no platform policy on top. It is the closest thing to ground truth for what your hardware and network can deliver under plain WebRTC. Platform policies vary by version, account type, and meeting configuration, so treat these as general tendencies rather than fixed rules. The practical consequence: comparing a Zoom call against a Meet call isn’t a camera test. It is a test of each platform’s encoding decisions. Measure the raw stream first with a plain WebRTC page or the webcam test tool. If the raw stream is clean and one platform still looks bad, the platform’s policy is the constraint, and no hardware upgrade will change it. When a platform call is in progress, chrome://webrtc-internals lets you watch its encoder decisions live, so you can see whether the downgrade is the platform’s policy or the network’s behavior without trusting either side’s self-report.
Seven Steps to a Clean Stream
These steps isolate distinct causes. You can stop as soon as the stream looks right — but measure before and after each change to confirm the fix actually moved the numbers.
- Measure first. Open chrome://webrtc-internals or use getStats() on your own peer connection and record resolution, frame rate, and bit rate. If the raw stream is already downgraded, your camera and connection are the problem. If it’s clean, the platform is.
- Check bandwidth. Video calls need at least 1 Mbps of upload for 720p and roughly 4 Mbps for 1080p. Test from the machine you call from, not another device, and retest with other traffic on the network. Move to a wired connection if you can; Wi-Fi loss is the single most common cause of invisible downgrades.
- Fix lighting. A well-lit subject compresses dramatically better than a dark one, because the encoder spends bit rate on visible detail rather than noise. Face a window or use a soft light source. This costs nothing and frequently produces a bigger improvement than any setting.
- Disable video noise reduction when your environment is already quiet and well-lit. Some platforms apply aggressive denoising in low-light scenes, which can soften fine detail noticeably in the encoded stream. The local preview will not show this difference; only the encoded stream will. Check the specific platform settings to confirm what controls are available.
- Disable virtual background. Background segmentation adds overhead to the effective bit rate and consumes GPU cycles from the encoder. A clean real background with consistent lighting beats any virtual one.
- Check the codec. If your CPU can handle it, VP9 delivers the best quality per bit; if you see frame drops or CPU spikes, H.264 encodes faster. Some platforms expose a codec preference in settings.
- Test a different platform. If quality is good on one service and poor on another, the platform’s encoding policy is the constraint. Adjust your expectations or your meeting tool accordingly — your hardware isn’t at fault.
Bottom line
The preview is your camera’s local self-image: a favorable view of what your camera can deliver to the browser. The stream is what the world actually sees — negotiated, compressed, and shaped by network conditions and platform policy. They are two different videos of the same subject, and only one of them matters for how you come across. If you have ever wondered why your camera looks great on your screen but terrible in the call, you now have the answer and the tool to measure it.
Open chrome://webrtc-internals. Join your next call. Watch the outbound-rtp entries. If frameWidth or framesPerSecond are below what you set in your camera settings, the downgrade is happening. The cause is typically bandwidth-related — what your browser is allowed to spend, and whether your connection can actually carry the stream you think you’re sending — but CPU load, encoder selection, platform policies, and constraint configuration can also contribute to or dominate the degradation.